IELTS Writing Task 1 Line Graph là một phần quen thuộc trong bài thi IELTS, yêu cầu thí sinh phân tích biểu đồ hoặc dữ liệu cụ thể. Chủ đề về Birth rate of women có thể làm khó nhiều thí sinh, đặc biệt khi cần phân tích chi tiết và logic.
Dù bạn đã quen với dạng bài này hay chưa, việc chuẩn bị kỹ càng và luyện tập trả lời theo cấu trúc chuẩn sẽ giúp bạn chinh phục phần thi Writing Task 1 Line Graph một cách tự tin. Qua bài viết này, chúng tôi sẽ hướng dẫn bạn cách phân tích biểu đồ, sử dụng từ vựng phù hợp, và luyện tập hiệu quả để đạt điểm cao.

I. Đề bài
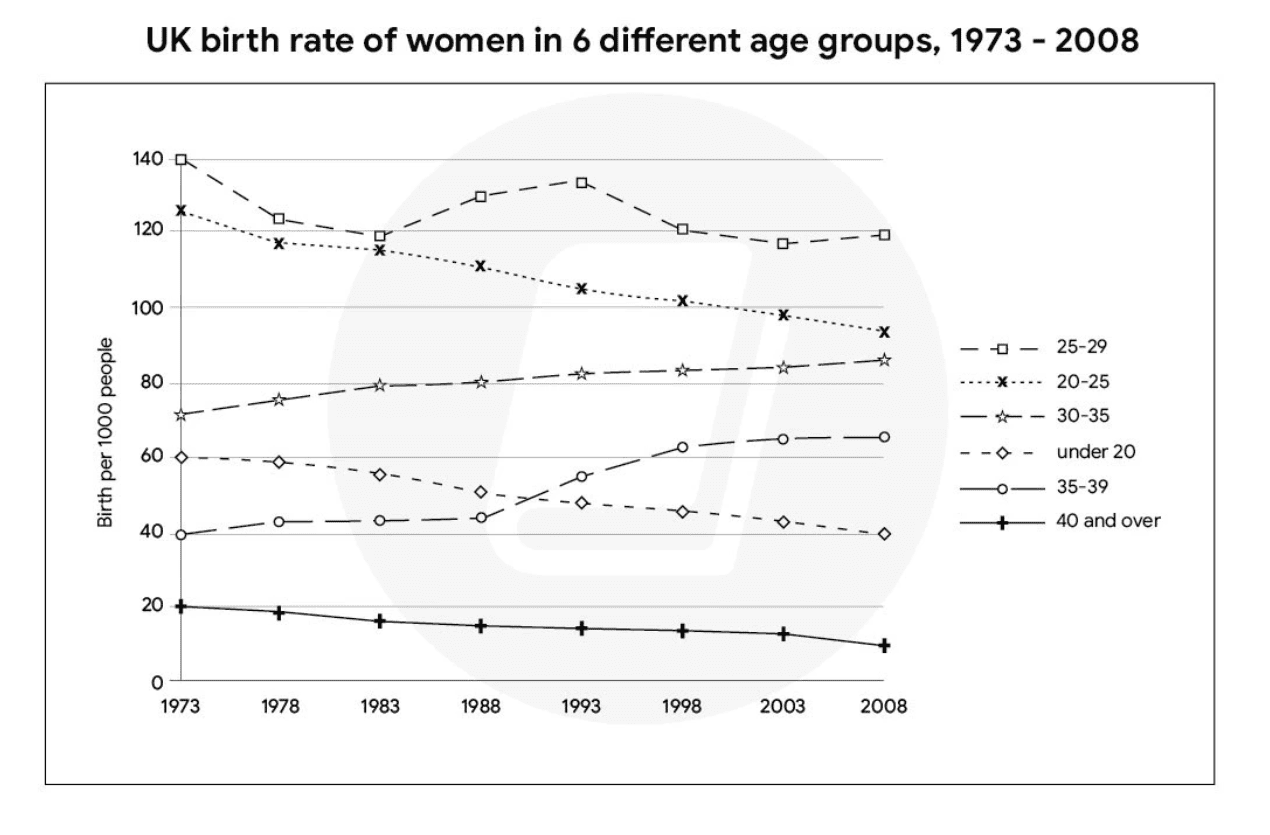
The graph below shows the changes in the birth rates for women in 6 different age groups in the UK from 1973 to 2008. Summarise the information by selecting and reporting the main features, and make comparisons where relevant.
II. Câu trả lời mẫu cho IELTS Writing Task 1 Line Graph
The line graph shows the birth rates for women in six different age groups in the UK from 1973 to 2008, measured per 1,000 people.
Overall, the birth rates for younger women (under 20 and 20-25 age groups) experienced significant declines, while the birth rates for older women (25-29, 30-35, and 35-39) either remained stable or increased slightly. The 40-and-over group consistently had the lowest birth rates throughout the period.
In 1973, the 20-25 age group had the highest birth rate, around 130 births per 1,000 people. However, this group’s birth rate steadily declined over the years, reaching about 60 per 1,000 by 2008. Similarly, the birth rate for women under 20 dropped from approximately 70 per 1,000 to just over 40 per 1,000 by 2008.
For the 25-29 age group, the birth rate decreased gradually from around 120 per 1,000 in 1973 to about 90 per 1,000 in 2008. In contrast, the 30-35 age group saw an increase, going from around 70 per 1,000 in the mid-1980s to approximately 80 per 1,000 by 2008. Women aged 35-39 also saw a steady rise in birth rates, from about 40 per 1,000 in 1973 to roughly 60 per 1,000 by the end of the period.
The birth rate for women aged 40 and over was consistently the lowest, starting at around 20 per 1,000 in 1973 and declining slightly to just under 20 per 1,000 by 2008.
In summary, the trend indicates a shift towards later motherhood, with birth rates for younger women decreasing and those for older women stabilizing or rising slightly.
III. Phân Tích Từ Vựng Quan Trọng trong Sample Answer Chủ Đề IELTS Writing Task 1 Line Graph
| Từ Vựng | Định Nghĩa (Tiếng Anh) | Định Nghĩa(Tiếng Việt) | Ví dụ |
| Birth rate | The number of births that happen during a period of time in a particular place | Tỷ lệ sinh | “The birth rate for women under 20 has declined steadily.” |
| Steady decline | A continuous and gradual decrease | Sự giảm ổn định | “The 20-25 age group experienced a steady decline in birth rates.” |
| Significant decline | A large and noticeable decrease | Sự giảm đáng kể | “There was a significant decline in birth rates for younger women.” |
| Remained stable | Stayed the same, showing little or no change | Giữ nguyên ổn định | “The birth rate for women in their 30s remained stable over the years.” |
| Increased slightly | Rose a little, a small increase | Tăng nhẹ | “Birth rates for women aged 35-39 increased slightly.” |
| Consistently | Happening continuously over a period of time | Liên tục | “The birth rate for the 40-and-over group was consistently the lowest.” |
| Highest birth rate | The group with the largest number of births that happen during a period of time in a particular place | Tỷ lệ sinh cao nhất | “In 1973, the 20-25 age group had the highest birth rate.” |
| Stabilizing | Becoming more constant or less likely to change | Ổn định | “The trend shows that birth rates for older women are stabilizing.” |
| Late motherhood | Having children at an older age | Làm mẹ muộn | “The trend indicates a shift towards late motherhood in the UK.” |
| Shift towards | Moving in the direction of something | Chuyển hướng | “There’s a shift towards older maternal ages.” |
IV. Bài tập thực hành IELTS Writing Task 1 Line Graph
1. Nối từ ở cột A với nghĩa ở cột B
| Cột A – Từ vựng | Cột B – Nghĩa |
|---|---|
| 1. Birth rate | a. The number of births per 1,000 people |
| 2. Steady decline | b. A continuous, gradual decrease |
| 3. Significant decline | c. A large, noticeable decrease |
| 4. Remained stable | d. Stayed the same |
| 5. Increased slightly | e. A small increase |
| 6. Consistently | f. Happening continuously over time |
| 7. Highest birth rate | g. The largest number of births per 1,000 people |
| 8. Stabilizing | h. Became more constant |
| 9. Late motherhood | i. Having children at an older age |
| 10. Shift towards | j. Moving in a certain direction |
Đáp án:
| Cột A – Từ vựng | Cột B – Nghĩa |
|---|---|
| 1. Birth rate | i. The number of births per 1,000 people |
| 2. Steady decline | c. A continuous, gradual decrease |
| 3. Significant decline | f. A large, noticeable decrease |
| 4. Remained stable | h. Stayed the same |
| 5. Increased slightly | a. A small increase |
| 6. Consistently | b. Happening continuously over time |
| 7. Highest birth rate | j. The largest number of births per 1,000 people |
| 8. Stabilizing | g. Became more constant |
| 9. Late motherhood | d. Having children at an older age |
| 10. Shift towards | e. Moving in a certain direction |
2. Sử dụng từ vựng từ Sample Answer IELTS Writing Task 1 Line Graph để điền vào chỗ trống
1. The __________ for women aged 20-25 saw a noticeable drop from 1973 to 2008.
2. Birth rates for women aged 35-39 __________ over the years, with a slight rise.
3. There is a clear __________ having children at later ages in the UK.
4. For older age groups, birth rates have __________ or slightly increased.
5. The 40-and-over group __________ had the lowest birth rate throughout the period.
6. The graph indicates a __________ in the birth rate for young women.
7. In 1973, the 20-25 age group had the __________ of all groups.
8. Birth rates for older women appear to be __________ rather than fluctuating.
9. Many women are moving towards __________, delaying childbirth to later years.
10. The overall __________ of birth rates for younger women highlights a shift in maternal age.
Đáp án:
1. The birth rate for women aged 20-25 saw a noticeable drop from 1973 to 2008.
2. Birth rates for women aged 35-39 remained stable over the years, with a slight rise.
3. There is a clear shift towards having children at later ages in the UK.
4. For older age groups, birth rates have stabilized or slightly increased.
5. The 40-and-over group consistently had the lowest birth rate throughout the period.
6. The graph indicates a significant decline in the birth rate for young women.
7. In 1973, the 20-25 age group had the highest birth rate of all groups.
8. Birth rates for older women appear to be stabilizing rather than fluctuating.
9. Many women are moving towards late motherhood, delaying childbirth to later years.
10. The overall steady decline of birth rates for younger women highlights a shift in maternal age.
3. Sử dụng các từ vựng chủ đề IELTS Writing Task 1 Line Graph để viết lại câu
1. The number of births per 1,000 people dropped significantly for young women.
Paraphrase: The __________ for young women saw a __________.
2. Women aged 30-35 saw a small increase in birth rates.
Paraphrase: Birth rates for women aged 30-35 __________.
3. The trend shows women are becoming mothers at later ages.
Paraphrase: There’s a __________ late motherhood.
4. Birth rates in the 25-29 age group stayed about the same.
Paraphrase: Birth rates in the 25-29 group __________ over time.
5. Older age groups experienced a continuous increase in birth rates.
Paraphrase: Birth rates for older women __________ over the years.
6. Women aged 20-25 had the highest number of births per 1,000 people.
Paraphrase: In 1973, women aged 20-25 had the __________.
7. Birth rates for younger women show a clear and continuous decrease.
Paraphrase: There was a __________ in birth rates for younger women.
8. The increase in birth rates for women aged 35-39 happened slowly.
Paraphrase: Birth rates for women aged 35-39 __________.
9. For women aged 30-35, birth rates are becoming more consistent.
Paraphrase: Birth rates in this group appear to be __________.
10. More women are now delaying childbirth to older ages.
Paraphrase: There’s a __________ women having children later.
Đáp án:
1. The birth rate for young women saw a significant decline.
2. Birth rates for women aged 30-35 increased slightly.
3. There’s a shift towards late motherhood.
4. Birth rates in the 25-29 group remained stable over time.
5. Birth rates for older women consistently increased over the years.
6. In 1973, women aged 20-25 had the highest birth rate.
7. There was a steady decline in birth rates for younger women.
8. Birth rates for women aged 35-39 increased slightly.
9. Birth rates for women aged 35-39 increased slightly.
10. There’s a shift towards late motherhood.
V. Kết luận
Nắm vững cách phân tích biểu đồ, kết hợp từ vựng phù hợp và luyện tập thường xuyên là chìa khóa để bạn đạt điểm cao trong IELTS Writing Task 1 Line Graph. Để hỗ trợ việc ôn luyện, chúng tôi đã tạo sẵn một bộ từ vựng trên Quizlet với các định nghĩa, ví dụ và dịch nghĩa cụ thể.
👉 Ôn tập từ vựng – IELTS Writing Task 1 Line Graph trên Quizlet
Hãy dành thời gian luyện tập và áp dụng những gì đã học vào bài viết của bạn. Chúc bạn học tốt và đạt kết quả cao!

Tham khảo thêm bài viết: IELTS Speaking Part 1 Running: Sample Answer & Vocabulary
Trên đây là câu hỏi mẫu và sample answer IELTS Writing Task 1 Line Graph band 7.5+ đầy đủ nhất được biên soạn bởi giáo viên IELTS 8.0+ tại Zest for English. Chúc bạn ôn tập hiệu quả và sớm đạt được band điểm mong muốn nhé!
Chia sẻ bài viết ngay!